k8s-ephemeral-storage-metrics
K8s Ephemeral Storage Metrics




A prometheus ephemeral storage metric exporter for pods, containers, nodes, and volumes.
This project was created to address lack of monitoring in Kubernetes
This project does not monitor CSI backed ephemeral storage ex. Generic ephemeral volumes
Overview
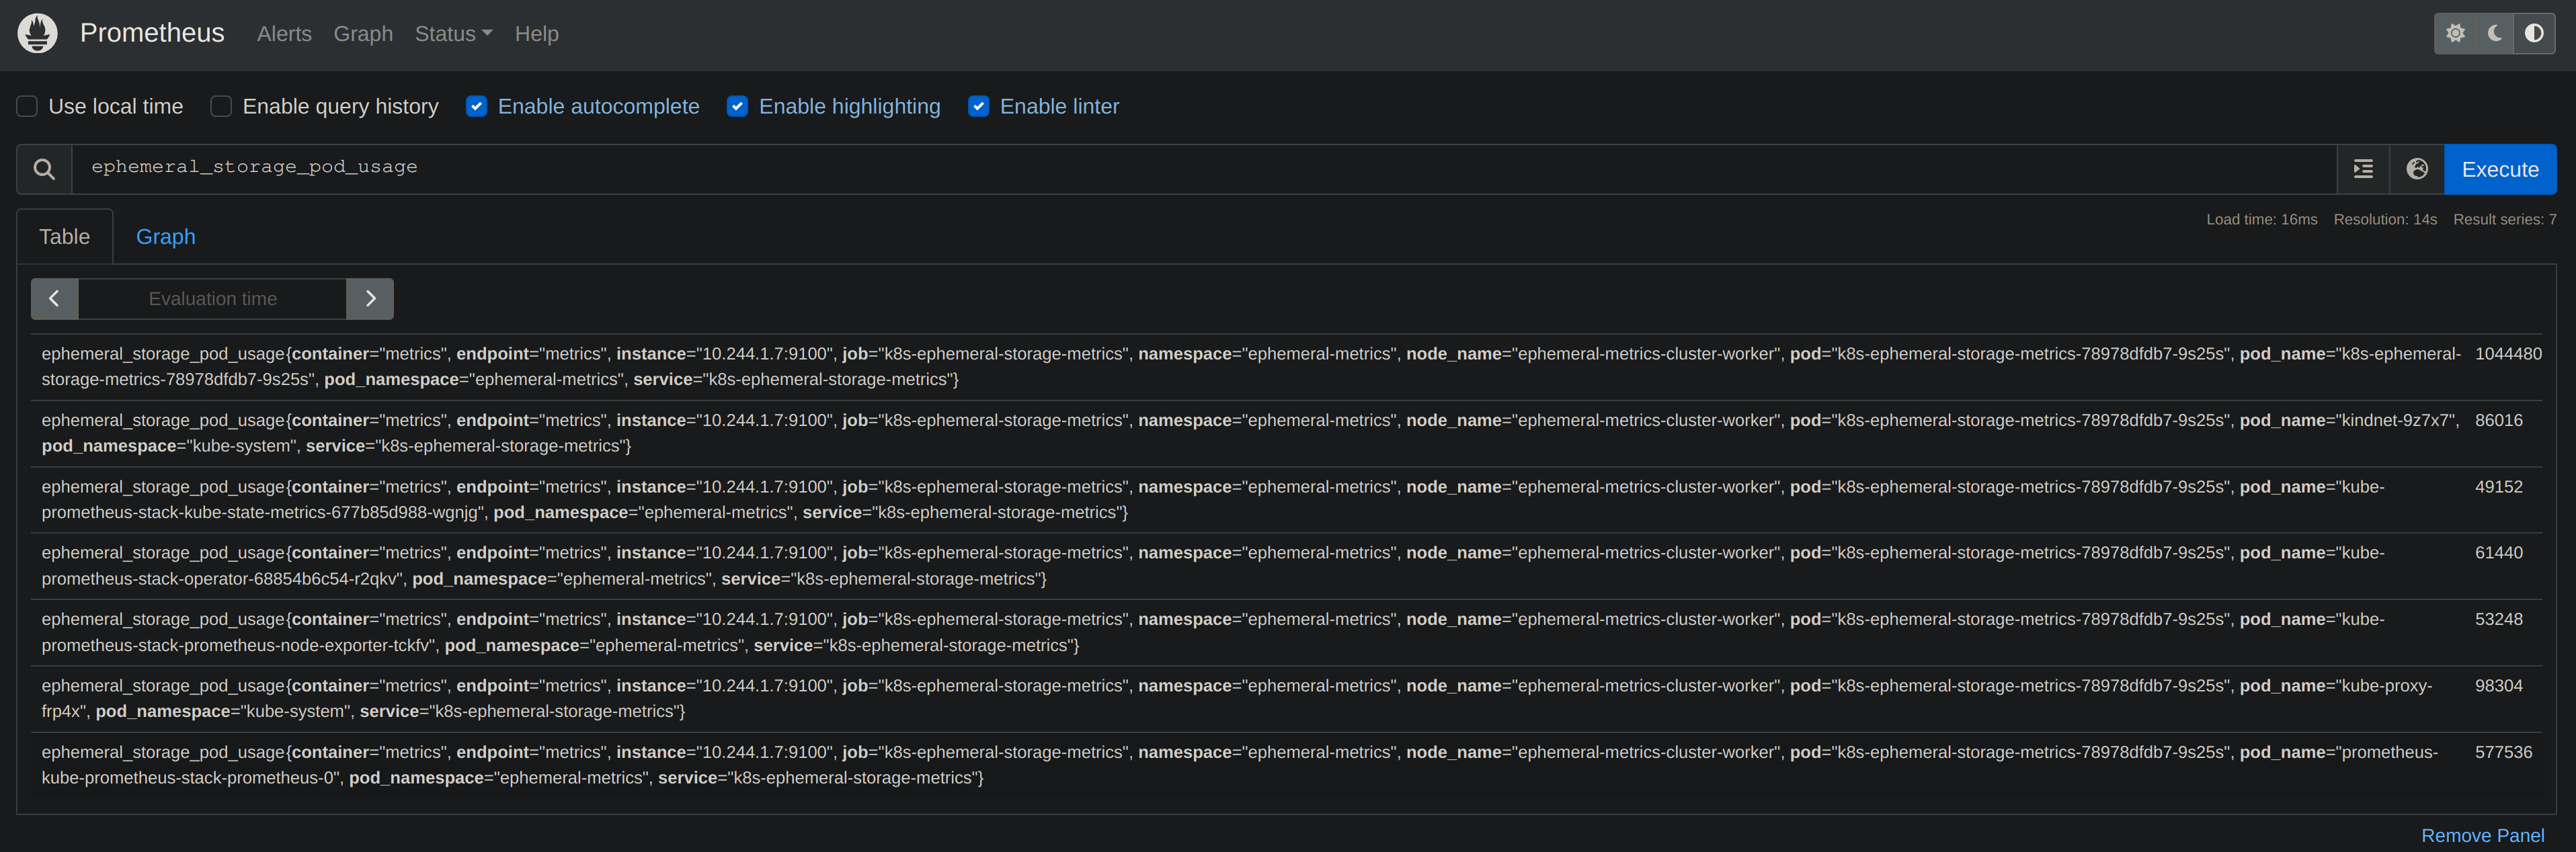
A Prometheus exporter for Kubernetes ephemeral storage. Emits per-node, per-pod, per-container, and per-volume metrics sourced from the kubelet /stats/summary endpoint (default) or the Kubernetes apiserver (SCRAPE_FROM_KUBELET=false).
Metric groups
- Node-level: available / capacity / percentage of node ephemeral storage
- Pod-level: usage (bytes), inodes / inodes free / inodes used
- Per-container rootfs + logs: used / available / capacity bytes, usage percentage, inodes / inodes free / inodes used
- Per-container volume (emptyDir): usage bytes, limit percentage
Labels
Every metric carries node_name. Pod/container metrics add pod_name, pod_namespace, container. Volume metrics add volume_name, mount_path.
DaemonSet vs Deployment
- DaemonSet (default): one exporter per node, scrapes local kubelet. Lighter apiserver load. Set
deploy_type: DaemonSet. - Deployment: single controller, lists all pods/nodes. Use
deploy_type: Deploymentplus optionalnode_label_selectorto filter nodes (e.g.type=virtual-kubeletto exclude virtual nodes).
For large clusters (2K+ nodes), set list_pods_with_cache: true to read pod lists from the apiserver cache and reduce apiserver pressure. Pair with deploy_type: DaemonSet so each pod only lists its own node’s pods (spec.nodeName fieldSelector).
Not monitored
This project does not monitor CSI-backed ephemeral storage, e.g. Generic ephemeral volumes.
Helm Install
helm repo add k8s-ephemeral-storage-metrics https://jmcgrath207.github.io/k8s-ephemeral-storage-metrics/chart
helm repo update
helm upgrade --install my-deployment k8s-ephemeral-storage-metrics/k8s-ephemeral-storage-metrics
Values
| Key | Type | Default | Description |
|---|---|---|---|
| affinity | object | {} |
|
| client_go_burst | int | 10 |
Maximum burst for throttle. |
| client_go_qps | int | 5 |
QPS indicates the maximum QPS to the master from this client. |
| containerSecurityContext.allowPrivilegeEscalation | bool | false |
|
| containerSecurityContext.capabilities.drop[0] | string | "ALL" |
|
| containerSecurityContext.privileged | bool | false |
|
| containerSecurityContext.readOnlyRootFilesystem | bool | false |
|
| containerSecurityContext.runAsNonRoot | bool | true |
|
| deploy_labels | object | {} |
Set additional labels for the Deployment/Daemonset |
| deploy_type | string | "Deployment" |
Set as Deployment for single controller to query all nodes or Daemonset |
| dev | object | {"enabled":false,"grow":{"image":"ghcr.io/jmcgrath207/k8s-ephemeral-storage-grow-test:latest","imagePullPolicy":"IfNotPresent"},"shrink":{"image":"ghcr.io/jmcgrath207/k8s-ephemeral-storage-shrink-test:latest","imagePullPolicy":"IfNotPresent"}} |
For local development or testing that will deploy grow and shrink pods and debug service |
| fullnameOverride | string | "" |
Override the full name of the chart |
| image.imagePullPolicy | string | "IfNotPresent" |
|
| image.imagePullSecrets | list | [] |
|
| image.repository | string | "ghcr.io/jmcgrath207/k8s-ephemeral-storage-metrics" |
|
| image.tag | string | "1.21.3" |
|
| interval | int | 15 |
Polling node rate for exporter |
| kubeconfig | string | "" |
Path to kubeconfig file; leave empty for in-cluster config |
| kubelet | object | {"insecure":false,"readOnlyPort":0,"scrape":false} |
Scrape metrics through kubelet instead of kube api |
| list_pods_with_cache | bool | false |
Use Kubernetes api server cache for pod list requests (reduces api server pressure at scale) |
| log_level | string | "info" |
|
| max_node_concurrency | int | 10 |
Max number of concurrent query requests to the kubernetes API. |
| metrics | object | {"adjusted_polling_rate":false,"ephemeral_storage_container_limit_percentage":true,"ephemeral_storage_container_logs_usage":true,"ephemeral_storage_container_rootfs_usage":true,"ephemeral_storage_container_volume_limit_percentage":true,"ephemeral_storage_container_volume_usage":true,"ephemeral_storage_inodes":true,"ephemeral_storage_node_available":true,"ephemeral_storage_node_capacity":true,"ephemeral_storage_node_percentage":true,"ephemeral_storage_pod_usage":true,"port":9100,"scrape_miss_tolerance":2} |
Set metrics you want to enable |
| metrics.adjusted_polling_rate | bool | false |
Create the ephemeral_storage_adjusted_polling_rate metrics to report Adjusted Poll Rate in milliseconds. Typically used for testing. |
| metrics.ephemeral_storage_container_limit_percentage | bool | true |
Percentage of ephemeral storage used by a container in a pod |
| metrics.ephemeral_storage_container_logs_usage | bool | true |
Current logs bytes used/available/capacity for a container in a pod |
| metrics.ephemeral_storage_container_rootfs_usage | bool | true |
Current rootfs bytes used/available/capacity for a container in a pod |
| metrics.ephemeral_storage_container_volume_limit_percentage | bool | true |
Percentage of ephemeral storage used by a container’s volume in a pod |
| metrics.ephemeral_storage_container_volume_usage | bool | true |
Current ephemeral storage used by a container’s volume in a pod |
| metrics.ephemeral_storage_inodes | bool | true |
Current ephemeral inode usage of pod |
| metrics.ephemeral_storage_node_available | bool | true |
Available ephemeral storage for a node |
| metrics.ephemeral_storage_node_capacity | bool | true |
Capacity of ephemeral storage for a node |
| metrics.ephemeral_storage_node_percentage | bool | true |
Percentage of ephemeral storage used on a node |
| metrics.ephemeral_storage_pod_usage | bool | true |
Current ephemeral byte usage of pod |
| metrics.port | int | 9100 |
Adjust the metric port as needed (default 9100) |
| metrics.scrape_miss_tolerance | int | 2 |
Number of consecutive scrapes a pod can be missing from the stats summary before its metrics are evicted |
| nameOverride | string | "" |
Override the name of the chart |
| nodeSelector | object | {} |
|
| node_label_selector | string | "" |
Label selector to filter watched nodes in Deployment mode (e.g. type=virtual-kubelet) |
| podAnnotations | object | {} |
|
| podSecurityContext.runAsNonRoot | bool | true |
|
| podSecurityContext.seccompProfile.type | string | "RuntimeDefault" |
|
| pod_labels | object | {} |
Set additional labels for the Pods |
| pprof | bool | false |
Enable Pprof |
| priorityClassName | string | nil |
|
| probes | object | {"liveness":{"failureThreshold":10,"initialDelaySeconds":10,"path":"/metrics","periodSeconds":10,"successThreshold":1,"timeoutSeconds":30},"readiness":{"failureThreshold":10,"path":"/health","periodSeconds":10,"successThreshold":1,"timeoutSeconds":1}} |
Liveness and Readiness probe configuration |
| probes.liveness | object | {"failureThreshold":10,"initialDelaySeconds":10,"path":"/metrics","periodSeconds":10,"successThreshold":1,"timeoutSeconds":30} |
Liveness probe configuration |
| probes.liveness.failureThreshold | int | 10 |
Number of consecutive failures required to consider the container as not ready |
| probes.liveness.initialDelaySeconds | int | 10 |
Delay before the first probe is initiated |
| probes.liveness.path | string | "/metrics" |
HTTP path used by the liveness probe |
| probes.liveness.periodSeconds | int | 10 |
How often to perform the probe |
| probes.liveness.successThreshold | int | 1 |
Minimum consecutive successes for the probe to be considered successful after having failed |
| probes.liveness.timeoutSeconds | int | 30 |
Number of seconds after which the probe times out |
| probes.readiness | object | {"failureThreshold":10,"path":"/health","periodSeconds":10,"successThreshold":1,"timeoutSeconds":1} |
Readiness probe configuration |
| probes.readiness.failureThreshold | int | 10 |
Number of consecutive failures required to consider the container as not ready |
| probes.readiness.path | string | "/health" |
HTTP path used by the readiness probe |
| probes.readiness.periodSeconds | int | 10 |
How often to perform the probe |
| probes.readiness.successThreshold | int | 1 |
Minimum consecutive successes for the probe to be considered successful after having failed |
| probes.readiness.timeoutSeconds | int | 1 |
Number of seconds after which the probe times out |
| prometheus.additionalLabels | object | {} |
Add labels to the PrometheusRule.Spec |
| prometheus.enable | bool | true |
|
| prometheus.release | string | "kube-prometheus-stack" |
|
| prometheus.rules.enable | bool | false |
Create PrometheusRules firing alerts when out of ephemeral storage |
| prometheus.rules.labels | object | {"severity":"warning"} |
What additional labels to set on alerts |
| prometheus.rules.predictFilledHours | int | 12 |
How many hours in the future to predict filling up of a volume |
| prometheus.rules.predictMinCurrentUsage | float | 33.3 |
What percentage of limit must be used right now to predict filling up of a volume |
| rbac | object | {"create":true} |
RBAC configuration |
| resources | object | {} |
Resource requests and limits for the container |
| revisionHistoryLimit | int | 10 |
Revision history limit for the Deployment |
| serviceAccount | object | {"create":true,"name":null} |
Service Account configuration |
| serviceAnnotations | object | {} |
Annotations to add to the metrics Service |
| serviceMonitor | object | {"additionalLabels":{},"enable":true,"metricRelabelings":[],"podTargetLabels":[],"relabelings":[],"targetLabels":[]} |
Configure the Service Monitor |
| serviceMonitor.additionalLabels | object | {} |
Add labels to the ServiceMonitor.Spec |
| serviceMonitor.metricRelabelings | list | [] |
Set metricRelabelings as per https://github.com/prometheus-operator/prometheus-operator/blob/main/Documentation/api.md#monitoring.coreos.com/v1.RelabelConfig |
| serviceMonitor.podTargetLabels | list | [] |
Set podTargetLabels as per https://github.com/prometheus-operator/prometheus-operator/blob/main/Documentation/api.md#monitoring.coreos.com/v1.ServiceMonitorSpec |
| serviceMonitor.relabelings | list | [] |
Set relabelings as per https://github.com/prometheus-operator/prometheus-operator/blob/main/Documentation/api.md#monitoring.coreos.com/v1.RelabelConfig |
| serviceMonitor.targetLabels | list | [] |
Set targetLabels as per https://github.com/prometheus-operator/prometheus-operator/blob/main/Documentation/api.md#monitoring.coreos.com/v1.ServiceMonitorSpec |
| tolerations | list | [] |
Prometheus alert rules
To prevent from multiple kind of alerts being fired for a single container or
emptyDir volume when both prometheus.enable and prometheus.rules.enable are
on, add the following inhibition
rules
to your Alert Manager config:
- source_matchers:
    - alertname="EphemeralStorageVolumeFilledUp"
  target_matchers:
    - severity="warning"
    - alertname="EphemeralStorageVolumeFillingUp"
  equal:
    - pod_namespace
    - pod_name
    - volume_name
- source_matchers:
    - alertname="ContainerEphemeralStorageUsageAtLimit"
  target_matchers:
    - severity="warning"
    - alertname="ContainerEphemeralStorageUsageReachingLimit"
  equal:
    - pod_namespace
    - pod_name
    - exported_container
Prerequisites
For local development / testing, install:
- Docker — image builds
- minikube — cluster (e2e is hardcoded to minikube node name; see Contribute)
- helm 3.x — chart install/upgrade
- kubectl — cluster interaction
- Go 1.26.5 — matches
go.modtoolchain
bin/{ginkgo,crane,helm-docs,gosec,govulncheck} are auto-installed by the Makefile on first use.
ENV modes
scripts/deploy.sh keys behavior off ENV={local|debug|e2e|e2e-debug|test}. The make deploy_* targets set this for you:
| Mode | Command | Behavior |
|---|---|---|
local (default) |
make deploy_local |
Build → helm install → port-forward :9100 → tail logs |
debug |
make deploy_debug |
Delve build → port-forward :30002 → connect dlv |
e2e |
make deploy_e2e |
Build → helm install → ginkgo -v -r tests/e2e (~15-25 min) |
e2e-debug |
make deploy_e2e_debug |
Build → helm install → hold for manual ginkgo/debug |
test |
make deploy_test |
Helm install with chart/test-values.yaml overrides |
Development tooling
| Task | Command |
|---|---|
| Format | make fmt |
| Vet | make vet |
| Security scan | make gosec |
| Vulnerability scan | make govulncheck |
| Helm render check (8 k8s versions) | make test-helm-render |
Regenerate docs (after values.yaml change) |
make helm-docs |
| Unit tests (~2s, no cluster) | make test-unit |
Run make fmt vet test-unit test-helm-render before opening a PR.
Contribute
Prereqs: Docker, minikube, helm, kubectl, Go 1.26.5.
Fork + branch from master.
Unit tests (no cluster)
make test-unit
Full e2e (~15-25 min)
make minikube_new_docker    # fresh minikube: calico CNI, registry addon, 3900MB
make deploy_e2e             # build 3 images, helm install, ginkgo tests
Local dev (no e2e)
make deploy_local # build + helm install + port-forward :9100 + tail logs
Local dev with Delve
make deploy_debug # port-forward :30002
Connect localhost:30002 with delve or your IDE.
Debug e2e
make deploy_e2e_debug # build + helm install, then holds
Then run ginkgo manually against deployment_test.go.
Pre-PR gate
make fmt vet test-unit test-helm-render
If chart/values.yaml changed, also run make helm-docs and commit the regenerated README.md + chart/README.md.
kind alternative
scripts/create_kind.sh (no Makefile wrapper) brings up a kind cluster. e2e will fail because tests/e2e/deployment_test.go hardcodes node_name="minikube" in regexes. Use kind for dev iteration only.
Troubleshooting
| Symptom | Fix |
|---|---|
| Port conflict on :9100 / :30002 / :6060 | sudo ss -aK '( sport = :PORT )' — trap_func cleans on normal exit only |
“registry endpoint is not healthy” during minikube_new_docker |
create-minikube.sh retries every 5s; if stuck >2 min, minikube delete && make minikube_new_docker |
| e2e hang on “Waiting for k8s-ephemeral-storage-metrics pod” | Minikube needs 3900MB memory floor. Or image push failed — check minikube registry |
| e2e hang on “Waiting for grow-test pod” | grow-test image not pushed; check crane push output in deploy.sh |
| ginkgo panics on run | Makefile pin out of sync with go.mod — rm bin/ginkgo && make ginkgo (pin must match github.com/onsi/ginkgo/v2 in go.mod, currently v2.32.0) |
| shrink-test e2e flakes | Shrinking reflects slowly from Node API (up to 5 min). Test waits for currentPodSize ≥ 11MB first |
License
This project is licensed under the MIT License. See the LICENSE file for more details.